Key Takeaways
- Sold listings totaled 3 in September 2026, with 11 active listings and 4 pending listings across Lake Clarke Shores.
- The absorption rate came in at 2.13 months, down 75.03% from 8.53 months a year ago; year-to-date it stands at 3.98 months, down from 5.92.
- Active list prices skewed high this month: the average list price rose 84.82% to $1,083,900 and the median list price rose 155.54% to $865,000, reflecting the premium waterfront inventory currently listed.
- Sale prices were mixed: the average sale price fell 44.66% to $466,667 and the median sale price fell 67.62% to $340,000 compared with September 2025.
- Days on market lengthened: the average CDOM reached 53 days (up 70.97% from 31) and the median 20 days (up from 18), giving buyers more time and more negotiating room.
- Year-to-date, the median sale price is $685,000 and the median list price is $767,500, a steadier read on this small waterfront community than any single month.
The Lake Clarke Shores September 2026 housing market report shows a small, tight waterfront market where monthly figures can swing sharply. Sold listings totaled 3, pending listings reached 4, and active inventory stood at 11 at the end of the month, with an absorption rate of 2.13 months compared with 8.53 months a year earlier.
Active list prices skewed high this month. The average list price rose 84.82% year over year to $1,083,900, and the median list price climbed 155.54% to $865,000, reflecting a mix of premium waterfront properties currently listed. Sale prices were mixed, with the median sale price down 67.62% to $340,000, while days on market lengthened, giving buyers more time and more negotiating room.
I am Rhonda Townsend with 1st Real Estate Solution Inc. After more than 12 years of helping buyers and sellers throughout Palm Beach County, including Lake Clarke Shores, I know that community-level data tells a more useful story than countywide averages alone. This report covers the full September 2026 numbers, the year-over-year comparison, the year-to-date trends, and what they may mean for your next move.
What Are the Key Lake Clarke Shores Housing Market Numbers for September 2026?
Here is a snapshot of the Lake Clarke Shores housing market at the end of September 2026, straight from the Beaches MLS market summary.
| Market Indicator | September 2026 |
|---|---|
| Sold Listings | 3 |
| Pending Listings | 4 |
| Active Listings | 11 |
3
Sold Listings
4
Pending
11
Active Listings
These numbers reflect completed transactions and active inventory for the full month of September 2026. Pending listings at 4 point to a small pipeline of closings in the weeks ahead, consistent with a community where homes rarely turn over.
Lake Clarke Shores is a tight-knit, canal-front community where water access drives value. With just 3 sales and 11 active listings in the month, every transaction carries real weight in the statistics, and both the year-over-year and year-to-date comparisons below should be read with that small-sample caveat in mind.
How Did Lake Clarke Shores Compare to September 2025?
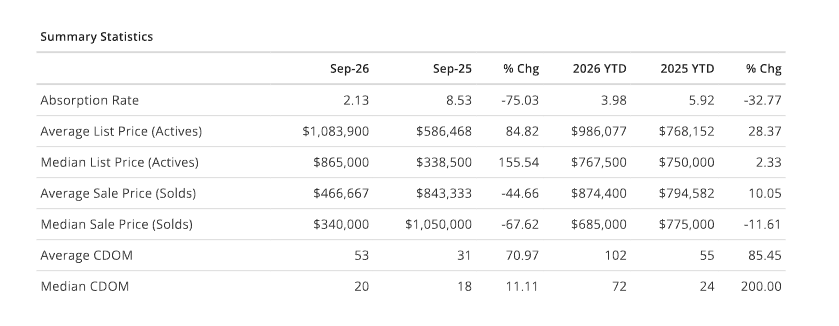
Across most measures, Lake Clarke Shores prices and market conditions shifted compared to September 2025, and the 2026 year-to-date figures show the broader trend through the first nine months of the year. Use your finger or cursor to scroll the table sideways on smaller screens to see all columns.
| Metric | Sep 2026 | Sep 2025 | Change | 2026 YTD | 2025 YTD | YTD Change |
|---|---|---|---|---|---|---|
| Absorption Rate | 2.13 months | 8.53 months | Down 75.03% | 3.98 months | 5.92 months | Down 32.77% |
| Average List Price (actives) | $1,083,900 | $586,468 | Up 84.82% | $986,077 | $768,152 | Up 28.37% |
| Median List Price (actives) | $865,000 | $338,500 | Up 155.54% | $767,500 | $750,000 | Up 2.33% |
| Average Sale Price (solds) | $466,667 | $843,333 | Down 44.66% | $874,400 | $794,582 | Up 10.05% |
| Median Sale Price (solds) | $340,000 | $1,050,000 | Down 67.62% | $685,000 | $775,000 | Down 11.61% |
| Average CDOM | 53 days | 31 days | Up 70.97% | 102 days | 55 days | Up 85.45% |
| Median CDOM | 20 days | 18 days | Up 11.11% | 72 days | 24 days | Up 200.00% |
Absorption Rate
Average List Price
Median List Price
Average Sale Price
Median Sale Price
Average CDOM
Median CDOM
The clearest theme this month is how far active list prices moved. The average list price on current inventory rose 84.82% year over year to $1,083,900, and the median list price jumped 155.54% to $865,000. Both figures reflect a very small inventory mix that skews toward premium waterfront properties with docks, seawalls, and direct water access, so they describe the current selection of homes for sale more than they describe neighborhood values across the board.
Closed prices were mixed. The average sale price fell 44.66% to $466,667, and the median sale price fell 67.62% to $340,000 compared with September 2025, when a high-value waterfront closing carried the monthly figures. With just 3 sales in September, the difference between the median and average is the difference between which specific homes happened to close, not a broad shift in the community's value.
What Do the 2026 Year-to-Date Numbers Show for Lake Clarke Shores?
Year-to-date data smooths out monthly ups and downs and shows the broader direction of the Lake Clarke Shores market through the first nine months of 2026. The YTD columns in the table above tell a steadier story than any single month.
The year-to-date median sale price of $685,000 is down 11.61% from $775,000 over the same period in 2025, while the year-to-date average sale price of $874,400 is up 10.05% from $794,582. On the listing side, the year-to-date average list price of $986,077 is up 28.37% and the median list price of $767,500 is up 2.33%, again reflecting a mix weighted toward higher-value waterfront properties.
The year-to-date absorption rate of 3.98 months, down 32.77% from 5.92 months a year ago, points to a tight waterfront market that continues to favor sellers, even as lower 2026 medians remind everyone that small-sample months can be misleading. Year-to-date market time has lengthened too, with the average CDOM at 102 days and the median at 72 days, giving buyers more breathing room than they had in 2025.
Key Takeaways from the September 2026 Lake Clarke Shores Market
Beyond the raw numbers, a few themes stand out for anyone watching Lake Clarke Shores this month.
First, this is a very small sample. With 3 sold listings and 11 active listings, Lake Clarke Shores offers buyers fewer choices than almost any other community in Palm Beach County, and every single transaction moves the monthly statistics. Second, the inventory currently listed skews toward the premium waterfront end of the market, which is why active list prices jumped 84.82% at the average and 155.54% at the median. Third, days on market has lengthened, which generally gives buyers more time to compare homes and negotiate.
Finally, treat the month-over-month swings with caution. A community with 3 sales in a month is inherently volatile. The year-to-date figures, including the 3.98-month absorption rate and $685,000 median sale price, are the more reliable measures of where this market really stands, and even those rest on a small volume of homes.
What Do These Numbers Mean for Lake Clarke Shores Buyers?
For buyers, the key takeaway is scarcity mixed with opportunity. With only 11 active listings, Lake Clarke Shores rewards preparation: being pre-approved, knowing what you want in a waterfront home, and being ready to act when the right property appears. At the same time, the longer days-on-market figures this year mean some sellers, particularly at higher price points, may be more open to negotiation.
The wide gap between the high active list prices and the mixed closed prices is worth reading carefully. List prices describe what sellers are asking, and closed prices describe what three specific homes sold for in September. You can see what is currently available on my search homes page, and my Lake Clarke Shores community guide covers the neighborhoods, waterfront blocks, and lifestyle considerations that matter when choosing where to buy. If you are new to the area, my buying guide walks through the rest of the process step by step.
What Do These Numbers Mean for Lake Clarke Shores Sellers?
For sellers, the September report is a reminder that pricing and presentation decide how quickly a home sells, especially in a market with so few active listings. The absorption rate of 2.13 months is tight on paper, but with just 11 homes for sale, your real competition is the handful of comparable listings buyers can choose between.
Homes with well-maintained docks and seawalls, clear flood and insurance documentation, and professional photography that captures the waterfront lifestyle tend to attract the strongest buyer interest. My selling guide covers pricing, marketing, and preparation, and if you are selling and buying at the same time, my sell-and-buy guide lays out the order of operations.
Keep Up with the Latest Market Reports
Market conditions shift month to month, so I publish regular updates for the communities I serve. Recent reports include the Port St. Lucie September 2026 market report, the Palm Beach County August 2026 market report, the Wellington August 2026 report, the West Palm Beach August 2026 report, and the Lake Clarke Shores August 2026 report. You can browse all of them from the market report page or the full articles page.
If you would like a personalized take on how these numbers apply to your Lake Clarke Shores property, price range, or timeline, I am happy to help. No pressure, just a clear plan for your next move.
Data cited in this article comes from the Beaches MLS Market Summary for Lake Clarke Shores, September 2026. Figures reflect residential market activity for the month unless noted, and are subject to revision.
Want a Closer Look at the Lake Clarke Shores Market?
Whether you want a personalized market analysis for your Lake Clarke Shores neighborhood or a step-by-step plan for your next move, I'm here to help with honest, expert guidance and a no-pressure approach.
Rhonda Townsend, REALTOR® · A.I. Certified Agent™ · 1st Real Estate Solution Inc.
(561) 236-9772 ·
rtownsendrealestate@gmail.com
Frequently Asked Questions
Sources
Sources referenced in this article:
- • Beaches MLS — Market data source
Disclaimer: This article is provided for general educational and real estate information only. Market statistics describe broader activity and do not determine the value, selling time, or future performance of a specific property. Data is sourced from BeachesMLS and public records and may be subject to revision. Consult a qualified professional regarding your individual circumstances.