Key Takeaways
- Sold listings totaled 379 in September 2026, with 400 pending listings and 2,336 active listings across Port St. Lucie.
- The absorption rate cooled to 5.15 months, down 17.20% from 6.22 months a year ago, giving buyers more inventory and more negotiating room.
- The median sale price was $400,000, down 3.15% year over year, while the median list price on active inventory rose 1.19% to $429,000.
- Homes took longer to sell: the average CDOM rose 12.35% to 91 days and the median CDOM rose 31.82% to 58 days.
- Year-to-date, the median sale price is $395,000 and the absorption rate stands at 5.72 months, confirming a cooler, more balanced 2026.
The Port St. Lucie September 2026 housing market report shows a market with more inventory and a slower pace of sales than a year ago. Sold listings totaled 379, pending listings reached 400, and active inventory stood at 2,336 at the end of the month.
Prices were roughly flat to slightly lower on the sold side, with the median sale price down 3.15% year over year to $400,000, while list prices on active inventory moved up modestly. Homes took longer to sell, with the average days on market up 12.35% to 91 days, and the absorption rate cooled to 5.15 months from 6.22 months a year earlier.
I am Rhonda Townsend with 1st Real Estate Solution Inc. After more than 12 years of helping buyers and sellers throughout Palm Beach County and the surrounding region, I have learned that monthly reports are most useful when we connect them to your specific neighborhood, property type, and goals. This report covers the full September 2026 numbers, the year-over-year comparison, the year-to-date trends, and what they may mean for your next move.
What Are the Key Port St. Lucie Housing Market Numbers for September 2026?
Here is a snapshot of the Port St. Lucie housing market at the end of September 2026, straight from the Beaches MLS market summary.
| Market Indicator | September 2026 |
|---|---|
| Sold Listings | 379 |
| Pending Listings | 400 |
| Active Listings | 2,336 |
379
Sold Listings
400
Pending
2,336
Active Listings
These numbers reflect completed transactions and active inventory for the full month of September 2026. Pending listings, at 400, slightly outnumber sold listings, which points to a steady pipeline of closings in the weeks ahead even as the market cools.
How Did Port St. Lucie Compare to September 2025?
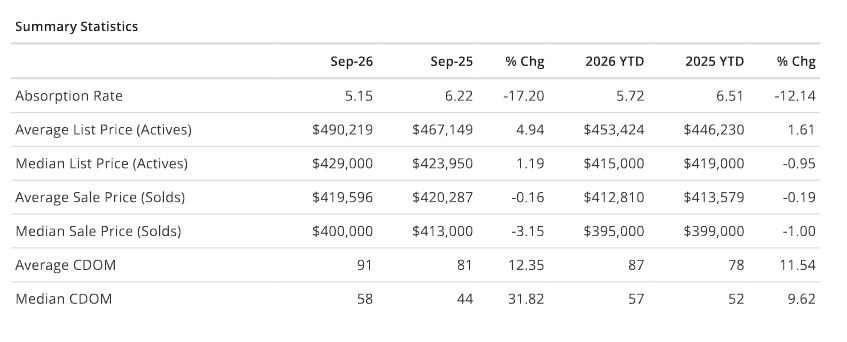
Across most measures, Port St. Lucie prices and market conditions shifted compared to September 2025. Use your finger or cursor to scroll this table sideways on smaller screens to see all columns.
| Metric | Sep 2026 | Sep 2025 | Change | 2026 YTD | 2025 YTD | YTD Change |
|---|---|---|---|---|---|---|
| Absorption Rate | 5.15 months | 6.22 months | Down 17.20% | 5.72 months | 6.51 months | Down 12.14% |
| Average List Price | $490,219 | $467,149 | Up 4.94% | $453,424 | $446,230 | Up 1.61% |
| Median List Price | $429,000 | $423,950 | Up 1.19% | $415,000 | $419,000 | Down 0.95% |
| Average Sale Price | $419,596 | $420,287 | Down 0.16% | $412,810 | $413,579 | Down 0.19% |
| Median Sale Price | $400,000 | $413,000 | Down 3.15% | $395,000 | $399,000 | Down 1.00% |
| Average CDOM | 91 days | 81 days | Up 12.35% | 87 days | 78 days | Up 11.54% |
| Median CDOM | 58 days | 44 days | Up 31.82% | 57 days | 52 days | Up 9.62% |
Absorption Rate
Average List Price
Median List Price
Average Sale Price
Median Sale Price
Average CDOM
Median CDOM
The clearest theme in the year-over-year comparison is time on market. The average CDOM rose 12.35% to 91 days, and the median rose 31.82% to 58 days, which means homes are sitting on the market noticeably longer than they did in September 2025. For buyers, that translates into more time to compare homes and negotiate. For sellers, it makes pricing and presentation more important than ever.
Sale prices moved in a narrow band. The average sale price was essentially flat, down just 0.16% to $419,596, while the median sale price eased 3.15% to $400,000. List prices on active inventory, by contrast, moved up modestly, with the average list price up 4.94% to $490,219 and the median up 1.19% to $429,000. That gap between asking prices and closed prices is a reminder that negotiation is a normal part of the process in this market.
What Do the Year-to-Date Numbers Show?
Year-to-date data helps smooth out monthly fluctuations and shows the broader direction of the market through the first nine months of 2026. The YTD columns in the table above tell a consistent story: sale prices are down slightly, list prices are up slightly, homes are taking longer to sell, and the absorption rate has cooled.
The year-to-date median sale price of $395,000 is down 1.00% from $399,000 over the same period in 2025, and the year-to-date average sale price of $412,810 is down 0.19%. On the listing side, the year-to-date average list price of $453,424 is up 1.61%, while the median list price of $415,000 is down 0.95%.
The year-to-date absorption rate of 5.72 months, down 12.14% from 6.51 months a year ago, confirms that Port St. Lucie has spent 2026 as a cooler, more balanced market than 2025. With year-to-date average CDOM at 87 days and median CDOM at 57 days, buyers have had more breathing room all year, not just in September.
Key Takeaways from the September 2026 Port St. Lucie Market
Beyond the raw numbers, a few themes stand out for anyone watching the Port St. Lucie market this month.
First, inventory is up and the pace has slowed. With 2,336 active listings and homes taking longer to sell, buyers have far more choice than they did a year ago. Second, prices are holding relatively steady: sale prices are roughly flat to slightly lower, while asking prices on new listings are up modestly.
Third, the absorption rate of 5.15 months sits below the six-month benchmark often used as the dividing line between a buyer's and seller's market, but the direction of travel is clearly toward balance. And fourth, negotiation is a bigger part of the process than it was last year, which is useful context for both sides to bring into their planning.
What Do These Numbers Mean for Port St. Lucie Buyers?
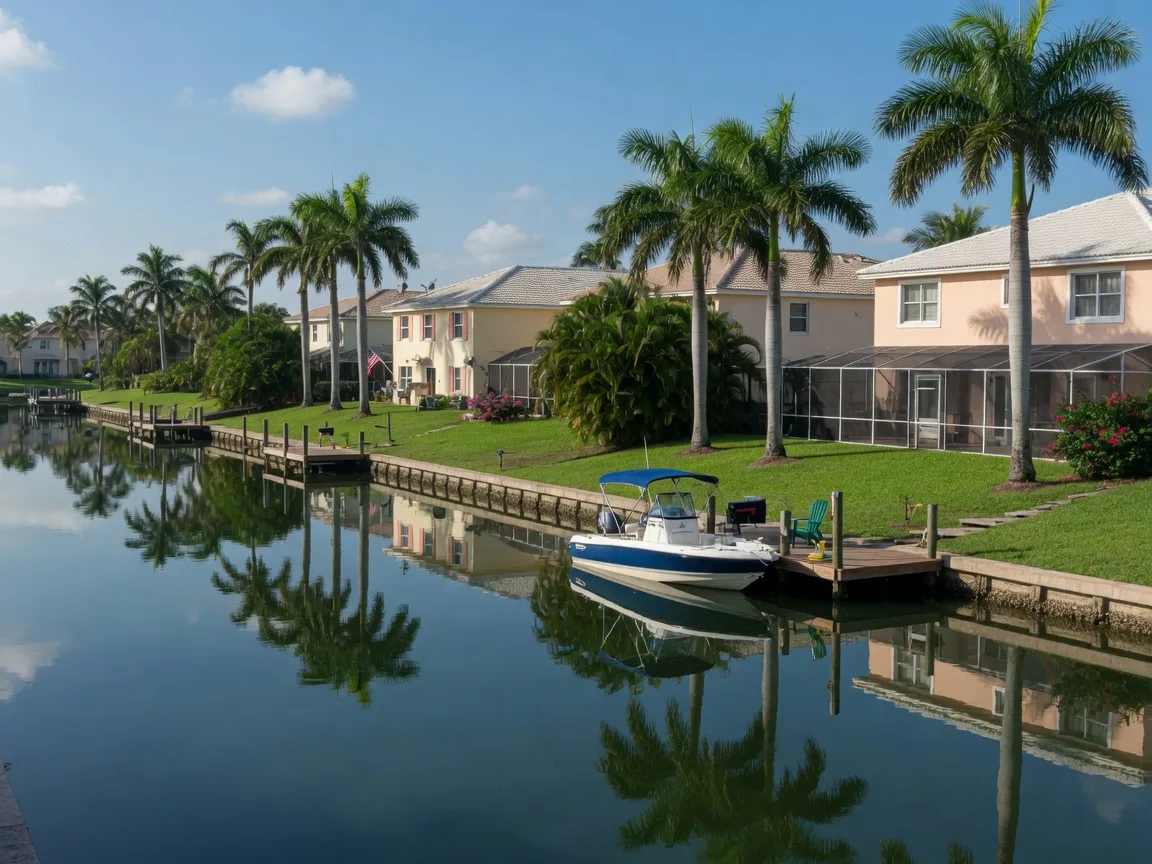
If you are buying, the September numbers are largely in your favor. Active inventory of 2,336 listings gives you real choice across Port St. Lucie, from entry-level homes to canal-front and newer construction, and the longer days-on-market figures mean you have more time to compare homes and negotiate without the same urgency as a year ago.
With the median sale price at $400,000 and the median list price at $429,000, there are homes across a wide range of price points to explore. You can browse what is currently available on my search homes page, and my Port St. Lucie community guide covers the neighborhoods, amenities, and lifestyle considerations that matter when choosing where to buy. If you are new to the area or buying from out of state, my buying guide can help you navigate the process.
What Do These Numbers Mean for Port St. Lucie Sellers?
For sellers, the September report is a reminder that the market has shifted. With the average home taking 91 days to sell and the median at 58 days, patience and realistic pricing are essential. Sale prices are roughly flat to slightly lower year over year, so anchoring your asking price to recent closed comparables matters more than it did in 2025.
The good news is that list prices on active inventory are up modestly, which means well-presented homes can still attract attention. If you are planning to sell and buy at the same time, coordination is everything. My guide to selling and buying at the same time walks through the order of operations, and my selling guide covers preparing your home for the market. My preparation checklist is a good place to start.
Keep Up with the Latest Market Reports
Market conditions shift month to month, so I publish regular updates for the communities I serve. Recent reports include the Palm Beach County August 2026 market report, the Wellington August 2026 report, the West Palm Beach August 2026 report, and the Lake Clarke Shores August 2026 report. You can browse all of them from the market report page or the full articles page.
If you would like a personalized take on how these numbers apply to your neighborhood, price range, or timeline, I am happy to help. Whether you are buying, selling, or just exploring your options, a conversation is the best way to turn this data into a plan.
Data cited in this article comes from the Beaches MLS Market Summary for Port St. Lucie, September 2026. Figures cover residential activity for the month unless noted.
Want a Closer Look at the Port St. Lucie Market?
Whether you want a personalized market analysis for your neighborhood or a step-by-step plan for your next move, I'm here to help with honest, expert guidance and no pressure.
Rhonda Townsend, REALTOR® · A.I. Certified Agent™ · 1st Real Estate Solution Inc.
(561) 236-9772 ·
rtownsendrealestate@gmail.com
Frequently Asked Questions
Sources
Sources referenced in this article:
- • Beaches MLS — Market data source
Disclaimer: This article is provided for general educational and real estate information only. Market statistics describe broader activity and do not determine the value, selling time, or future performance of a specific property. Data is sourced from BeachesMLS and public records and may be subject to revision. Consult a qualified professional regarding your individual circumstances.